Our purpose and strategy
Our purpose is Helping Britain Prosper.

Our purpose is Helping Britain Prosper.

We have an important role to play in creating a more sustainable and inclusive future.
Lloyds Banking Group incorporates many household names.

As with all necessary struggles it’s often the actions of brilliant and tenacious individuals that create lasting change.

This report provides an update on our progress towards the Group's sustainability ambitions.

We put you first, so you can put our customers first.

Our charitable Foundations are celebrating 40 years of tackling social disadvantage and Helping Britain Prosper.

Disclosures relating to our strategic, financial, operational, environmental and social performance.

See all the key dates in the financial year.

Higher, more sustainable returns as we continue to Help Britain Prosper.

How Lloyds Banking Group is delivering against its strategy and achieving growth.

Build something that changes everything. Join us as we explore new ideas and technologies to reshape the world of finance.

Xinyi is pioneering AI and advanced analytics at the Group alongside her part-time role as a concert pianist.
Lloyds Banking Group is best known for its portfolio of financial services brands.
Our purpose is Helping Britain Prosper.
We have an important role to play in creating a more sustainable and inclusive future.
Lloyds Banking Group incorporates many household names.
As with all necessary struggles it’s often the actions of brilliant and tenacious individuals that create lasting change.
This report provides an update on our progress towards the Group's sustainability ambitions.
We put you first, so you can put our customers first.
Our charitable Foundations are celebrating 40 years of tackling social disadvantage and Helping Britain Prosper.
Disclosures relating to our strategic, financial, operational, environmental and social performance.
See all the key dates in the financial year.
Higher, more sustainable returns as we continue to Help Britain Prosper.
How Lloyds Banking Group is delivering against its strategy and achieving growth.
Build something that changes everything. Join us as we explore new ideas and technologies to reshape the world of finance.
Xinyi is pioneering AI and advanced analytics at the Group alongside her part-time role as a concert pianist.
Lloyds Banking Group is best known for its portfolio of financial services brands.
20 March 2025
Demand for larger homes has driven growth in UK property prices over the past year, according to new research by Halifax.
As easing interest rates improved mortgage affordability, annual property price growth reached +3.7% in January 2025, up from just 1.0% at the start of 2024. In cash terms, prices increased by £10,431, with the average cost now at £294,818, surpassing the previous peak in August 2022 during the pandemic-era property boom.
The analysis – based on data from the Halifax House Price Index – reveals significant variations in price growth across different property types and regions. Terraced houses lead the way with annual growth of +4.5%, reaching £235,296, while detached properties increased by +4.1% to £471,748.
In contrast, flats saw the slowest growth at +3.2%, with an average price of £168,569. Semi-detached houses rose by +3.8%, averaging £307,685.
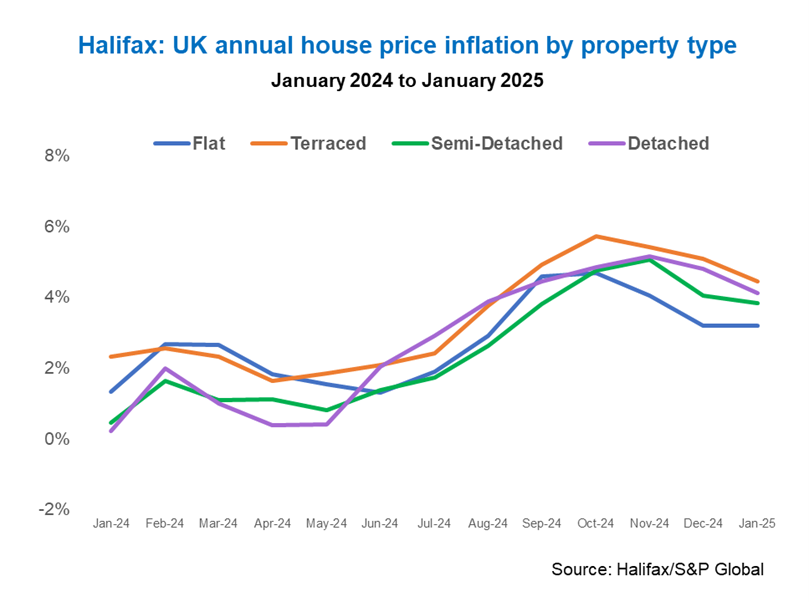
Price growth for flats fluctuated significantly over the last year, from 1.3% in January 2024 to a peak of +4.7% in October, before easing to +3.2% at the start of 2025.
Despite this, the average price of £168,569 remains just £1,824 below the peak recorded in August 2022.
Regionally, the North East saw the strongest growth in flat prices, rising by +15.1% (£13,141) to £100,123, while the East Midlands experienced a slight decrease of -0.6% (-£705).
Terraced homes led house price growth for much of the last year, peaking at +5.7% in October 2024. They began 2025 at +4.5%, with the average price now at £235,296, up by £10,025 over the last year.
The North East saw the highest annual increase for terraced houses at +8.4% (£10,263), while Yorkshire and Humberside had the slowest growth at +2.7%. As with flats, the North East has seen prices for terraced houses rise the most on an annual basis, up by +8.4% (£10,263).
Semi-detached houses recorded growth of +3.8% over the last year, increasing by £11,367 in cash terms, with the average price now at £307,685.
Northern Ireland saw the biggest increase at +7.0% (£11,835), while Scotland had the slowest growth at +0.7%.
At the top end of the size scale, detached houses saw annual growth of +4.1% (£18,704). The average price of £471,748 is above the pandemic-era peak set in September 2022 (£471,333) and just shy of the new high set in September last year (£472,984).
Northern Ireland recorded the strongest annual growth at +15.2% (up £35,857), while London had the weakest at +0.9%, though it still has the most expensive detached properties in the UK (£944,526). This is around five times more than the cheapest in the North East (£190,757).
|
UK average house price UK average house price by property type |
All |
Flat |
Terraced |
Semi-detached |
Detached |
|---|---|---|---|---|---|
|
UK average house price UK average house price by property type Average price January 2024 |
All £284,388 |
Flat £163,348 |
Terraced £225,271 |
Semi-detached £296,317 |
Detached £453,044 |
|
UK average house price UK average house price by property type Average price January 2025 |
All £294,818 |
Flat £168,569 |
Terraced £235,296 |
Semi-detached £307,685 |
Detached £471,748 |
|
UK average house price UK average house price by property type Percentage growth |
All +3.7% |
Flat +3.2% |
Terraced +4.5% |
Semi-detached +3.8% |
Detached +4.1% |
|
UK average house price UK average house price by property type Price change |
All £10,431 |
Flat £5,221 |
Terraced £10,025 |
Semi-detached £11,367 |
Detached £18,704 |
Amanda Bryden, Head of Halifax Mortgages, said:
“The fortunes of different property types tend to ebb and flow depending on broader market conditions. This time last year, the average price of a flat had risen more quickly than a detached house, as buyers adjusted to higher borrowing costs and sought to compensate by targeting smaller properties.
“Now, as interest rates have started to ease, it’s once again those homes offering more space which are fuelling demand. And that’s not just a short-term trend; over the last decade, bigger properties have tended to outperform smaller homes when it comes to price growth.
“This has caused the gap between the rungs on the housing ladder to widen further, presenting a bigger challenge to those looking to make the step up. However, that only tells part of the story. Slower growth among smaller homes is helpful for first-time buyers, and we saw a big rebound in that group last year.
“If you look beyond the UK picture to the individual nations and regions, there’s huge variance in average price performance for different property types, with many areas offering more value for money”.
The first-time buyer market rebounded last year, as a fifth more stepped onto the ladder.
Once again improved mortgage affordability saw larger properties experience the strongest price growth, with terraced homes rising by +3.5%, semi-detached by +2.9%, and detached by +2.8%. Flats lagged behind at +1.8%.
Flats account for around 27% of first-time buyer purchases in the UK, varying significantly by region, from 71% in London to 4% in the East Midlands.
|
UK property types bought by first-time buyers January 2024 to January 2025 |
Proportion |
|---|---|
|
UK property types bought by first-time buyers January 2024 to January 2025 Flats |
Proportion 27% |
|
UK property types bought by first-time buyers January 2024 to January 2025 Terraced |
Proportion 29% |
|
UK property types bought by first-time buyers January 2024 to January 2025 Semi-detached |
Proportion 29% |
|
UK property types bought by first-time buyers January 2024 to January 2025 Detached |
Proportion 15% |
22 January 2025 | Andrew Asaam
Homes Director Andrew Asaam looks at what could impact the housing market this year, and why it's hard for younger adults to buy a home right now.
|
UK average house price UK average first-time buyer price by property type |
All |
Flat |
Terraced |
Semi-detached |
Detached |
|---|---|---|---|---|---|
|
UK average house price UK average first-time buyer price by property type Average price January 2024 |
All £227,792 |
Flat £151,071 |
Terraced £202,934 |
Semi-detached £260,191 |
Detached £374,403 |
|
UK average house price UK average first-time buyer price by property type Average price January 2025 |
All £235,195 |
Flat £153,791 |
Terraced £209,985 |
Semi-detached £267,697 |
Detached £384,717 |
|
UK average house price UK average first-time buyer price by property type Percentage growth |
All +3.2% |
Flat +1.8% |
Terraced +3.5% |
Semi-detached +2.9% |
Detached +2.8% |
|
UK average house price UK average first-time buyer price by property type Price change |
All £7,402 |
Flat £2,720 |
Terraced £7,051 |
Semi-detached £7,505 |
Detached £10,314 |
A category where flats buck the trend is new builds. While overall growth over the last year for newly built properties was +3.1%, for new build flats it was much higher, at +6.7%.
Terraced (+3.6%), semi-detached (+2.2%) and detached (+2.4%) houses all trailed behind in annual property price inflation.
Buyers of new builds continue to pay a significant premium compared to existing properties, at £33,514 overall and up to £71,865 for flats.
|
UK average new build price by property type |
All |
Flat |
Terraced |
Semi-detached |
Detached |
|---|---|---|---|---|---|
|
UK average new build price by property type Average price January 2024 |
All £304,997 |
Flat £222,432 |
Terraced £285,559 |
Semi-detached £348,026 |
Detached £504,400 |
|
UK average new build price by property type Average price January 2025 |
All £314,587 |
Flat £237,427 |
Terraced £295,817 |
Semi-detached £355,619 |
Detached £516,335 |
|
UK average new build price by property type Percentage growth |
All +3.1% |
Flat +6.7% |
Terraced +3.6% |
Semi-detached +2.2% |
Detached +2.4% |
|
UK average new build price by property type Price change |
All £9,590 |
Flat £14,995 |
Terraced £10,258 |
Semi-detached £7,594 |
Detached £11,935 |
|
UK average new build price by property type Premium to existing properties |
All £33,514 |
Flat £71,865 |
Terraced £63,192 |
Semi-detached £50,946 |
Detached £42,709 |
Since the turn of the century, the cost gap between different property types has widened significantly.
In the year 2000, the cost of the average flat was just £49,905. An extra £9,105 would get a terraced house, a further £22,006 a semi-detached house, and an additional £51,655 on top of that would secure a detached property.
Fast forward to 2025, and the cost of the average flat is now £168,569. An extra £66,726 would be needed for a terraced house, a further £72,389 for a semi-detached house, and another £164,063 for a detached property.
However, in relative terms, the cost of a flat compared to a detached house – a measure of the gap between the rungs of the housing ladder – has only slightly increased from 2.66 times in 2000 to 2.8 times in 2025.

Over the last five years – a timeframe which includes both the pandemic-era housing market boom and subsequent slowdown as interest rates rose – house prices have increased at a faster pace than in the preceding five-year period (+25.1% vs +23.8%).
This trend is true for all for all property types except flats, which rose by +16.7% compared to +22.3% in the previous five years.
That’s in contrast to detached houses, which saw the highest growth of +29.6% over the last five years (vs +23.7% in the preceding period), adding more than £100,000 to the average value since 2020.
|
UK average house price by property type |
All |
Flat |
Terraced |
Semi-detached |
Detached |
|---|---|---|---|---|---|
|
UK average house price by property type Average price January 2025 |
All £190,382 |
Flat £118,098 |
Terraced £148,417 |
Semi-detached £194,618 |
Detached £294,252 |
|
UK average house price by property type Average price January 2020 |
All £235,647 |
Flat £144,436 |
Terraced £185,775 |
Semi-detached £242,365 |
Detached £516,335 |
|
UK average house price by property type Average price January 2025 |
All £294,818 |
Flat £168,569 |
Terraced £235,296 |
Semi-detached £307,685 |
Detached £471,748 |
|
UK average house price by property type Percentage growth 2015 - 20 |
All +23.8% |
Flat +22.3% |
Terraced +25.2% |
Semi-detached +24.5% |
Detached +23.7% |
|
UK average house price by property type Percentage growth 2020 - 25 |
All +25.1% |
Flat +16.7% |
Terraced +26.7% |
Semi-detached +27.0% |
Detached +29.6% |

Head of Halifax Intermediaries and Scottish Widows Bank, Lloyds Banking Group
Amanda joined Lloyds Banking Group in 2022 as head of Halifax Intermediaries and Scottish Widows Bank. Nurturing relationships with mortgage brokers across the UK, the Halifax Intermediary team deliver over 85% of the banks mortgage business and help turn home ownership dreams into a reality.
Amanda has enjoyed a successful career in the mortgage industry that spans more than 26 years. Her career in the sector started as a mortgage broker and she has gone on to enjoy a variety of senior roles across 3 of the top 6 mortgage lenders. Amandas experience brings the insight to support mortgage brokers in delivering excellent customer outcomes, and the depth of knowledge to ensure the partnerships between lenders and brokers can continue to be meaningful and mutually beneficial.

22 January 2025 | Andrew Asaam
Homes Director Andrew Asaam looks at what could impact the housing market this year, and why it's hard for younger adults to buy a home right now.
Table 1: Property type: ALL PROPERTIES
Regional average property price change between January 2024 and January 2025
|
Region |
Average price Jan 24 |
Average price Jan 25 |
£ change |
% Change |
|---|---|---|---|---|
|
Region East Midlands |
Average price Jan 24 £234,700 |
Average price Jan 25 £242,581 |
£ change £7,881 |
% Change 3.4% |
|
Region Eastern England |
Average price Jan 24 £325,574 |
Average price Jan 25 £334,232 |
£ change £8,658 |
% Change 2.7% |
|
Region Greater London |
Average price Jan 24 £526,571 |
Average price Jan 25 £540,861 |
£ change £14,290 |
% Change 2.7% |
|
Region North East |
Average price Jan 24 £167,769 |
Average price Jan 25 £176,464 |
£ change £8,695 |
% Change 5.2% |
|
Region North West |
Average price Jan 24 £227,529 |
Average price Jan 25 £237,681 |
£ change £10,152 |
% Change 4.5% |
|
Region Northern Ireland |
Average price Jan 24 £193,653 |
Average price Jan 25 £205,035 |
£ change £11,382 |
% Change 5.9% |
|
Region Scotland |
Average price Jan 24 £203,066 |
Average price Jan 25 £207,909 |
£ change £4,843 |
% Change 2.4% |
|
Region South East |
Average price Jan 24 £377,044 |
Average price Jan 25 £387,984 |
£ change £10,940 |
% Change 2.9% |
|
Region South West |
Average price Jan 24 £293,678 |
Average price Jan 25 £305,170 |
£ change £11,492 |
% Change 3.9% |
|
Region Wales |
Average price Jan 24 £217,121 |
Average price Jan 25 £224,875 |
£ change £7,755 |
% Change 3.6% |
|
Region West Midlands |
Average price Jan 24 £248,761 |
Average price Jan 25 £258,617 |
£ change £9,856 |
% Change 4.0% |
|
Region Yorkshire & Humberside |
Average price Jan 24 £204,084 |
Average price Jan 25 £213,459 |
£ change £9,376 |
% Change 4.6% |
|
Region United Kingdom |
Average price Jan 24 £284,388 |
Average price Jan 25 £294,818 |
£ change £10,431 |
% Change 3.7% |
Table 2: Property type: FLATS
Regional average property price change between January 2024 and January 2025
|
Region |
Average price Jan 24 |
Average price Jan 25 |
£ change |
% Change |
|---|---|---|---|---|
|
Region East Midlands |
Average price Jan 24 £126,928 |
Average price Jan 25 £126,223 |
£ change -£705 |
% Change -0.6% |
|
Region Eastern England |
Average price Jan 24 £193,169 |
Average price Jan 25 £198,340 |
£ change £5,171 |
% Change 2.7% |
|
Region Greater London |
Average price Jan 24 £371,357 |
Average price Jan 25 £379,922 |
£ change £8,565 |
% Change 2.3% |
|
Region North East |
Average price Jan 24 £86,982 |
Average price Jan 25 £100,123 |
£ change £13,141 |
% Change 15.1% |
|
Region North West |
Average price Jan 24 £124,287 |
Average price Jan 25 £130,986 |
£ change £6,699 |
% Change 5.4% |
|
Region Northern Ireland |
Average price Jan 24 £111,894 |
Average price Jan 25 £115,043 |
£ change £3,149 |
% Change 2.8% |
|
Region Scotland |
Average price Jan 24 £116,096 |
Average price Jan 25 £118,358 |
£ change £2,262 |
% Change 1.9% |
|
Region South East |
Average price Jan 24 £220,553 |
Average price Jan 25 £223,850 |
£ change £3,297 |
% Change 1.5% |
|
Region South West |
Average price Jan 24 £176,494 |
Average price Jan 25 £180,363 |
£ change £3,869 |
% Change 2.2% |
|
Region Wales |
Average price Jan 24 £110,654 |
Average price Jan 25 £121,317 |
£ change £10,663 |
% Change 9.6% |
|
Region West Midlands |
Average price Jan 24 £134,050 |
Average price Jan 25 £134,254 |
£ change £204 |
% Change 0.2% |
|
Region Yorkshire & Humberside |
Average price Jan 24 £114,917 |
Average price Jan 25 £118,161 |
£ change £3,244 |
% Change 2.8% |
|
Region United Kingdom |
Average price Jan 24 £163,348 |
Average price Jan 25 £168,569 |
£ change £5,221 |
% Change 3.2% |
Table 3: Property type: TERRACED HOUSES
Regional average property price change between January 2024 and January 2025
|
Region |
Average price Jan 24 |
Average price Jan 25 |
£ change |
% Change |
|---|---|---|---|---|
|
Region East Midlands |
Average price Jan 24 £182,559 |
Average price Jan 25 £188,530 |
£ change £5,971 |
% Change 3.3% |
|
Region Eastern England |
Average price Jan 24 £283,961 |
Average price Jan 25 £296,254 |
£ change £12,292 |
% Change 4.3% |
|
Region Greater London |
Average price Jan 24 £539,613 |
Average price Jan 25 £558,315 |
£ change £18,702 |
% Change 3.5% |
|
Region North East |
Average price Jan 24 £121,652 |
Average price Jan 25 £131,914 |
£ change £10,263 |
% Change 8.4% |
|
Region North West |
Average price Jan 24 £167,602 |
Average price Jan 25 £174,571 |
£ change £6,970 |
% Change 4.2% |
|
Region Northern Ireland |
Average price Jan 24 £119,403 |
Average price Jan 25 £127,254 |
£ change £7,852 |
% Change 6.6% |
|
Region Scotland |
Average price Jan 24 £153,207 |
Average price Jan 25 £162,310 |
£ change £9,104 |
% Change 5.9% |
|
Region South East |
Average price Jan 24 £321,738 |
Average price Jan 25 £333,855 |
£ change £12,117 |
% Change 3.8% |
|
Region South West |
Average price Jan 24 £247,577 |
Average price Jan 25 £257,742 |
£ change £10,165 |
% Change 4.1% |
|
Region Wales |
Average price Jan 24 £154,879 |
Average price Jan 25 £164,874 |
£ change £9,995 |
% Change 6.5% |
|
Region West Midlands |
Average price Jan 24 £196,185 |
Average price Jan 25 £210,971 |
£ change £14,787 |
% Change 7.5% |
|
Region Yorkshire & Humberside |
Average price Jan 24 £162,254 |
Average price Jan 25 £166,633 |
£ change £4,379 |
% Change 2.7% |
|
Region United Kingdom |
Average price Jan 24 £225,271 |
Average price Jan 25 £235,296 |
£ change £10,025 |
% Change 4.5% |
Table 4: Property type: SEMI-DETACHED HOUSES
Regional average property price change between January 2024 and January 2025
|
Region |
Average price Jan 24 |
Average price Jan 25 |
£ change |
% Change |
|---|---|---|---|---|
|
Region East Midlands |
Average price Jan 24 £238,080 |
Average price Jan 25 £247,990 |
£ change £9,910 |
% Change 4.2% |
|
Region Eastern England |
Average price Jan 24 £361,061 |
Average price Jan 25 £374,116 |
£ change £13,055 |
% Change 3.6% |
|
Region Greater London |
Average price Jan 24 £659,035 |
Average price Jan 25 £685,800 |
£ change £26,765 |
% Change 4.1% |
|
Region North East |
Average price Jan 24 £183,277 |
Average price Jan 25 £190,757 |
£ change £7,480 |
% Change 4.1% |
|
Region North West |
Average price Jan 24 £237,873 |
Average price Jan 25 £252,207 |
£ change £7,480 |
% Change 6.0% |
|
Region Northern Ireland |
Average price Jan 24 £169,318 |
Average price Jan 25 £181,153 |
£ change £14,334 |
% Change 7.0% |
|
Region Scotland |
Average price Jan 24 £211,483 |
Average price Jan 25 £213,067 |
£ change £11,835 |
% Change 0.7% |
|
Region South East |
Average price Jan 24 £407,801 |
Average price Jan 25 £423,887 |
£ change £16,086 |
% Change 3.9% |
|
Region South West |
Average price Jan 24 £316,422 |
Average price Jan 25 £328,315 |
£ change £11,893 |
% Change 3.8% |
|
Region Wales |
Average price Jan 24 £211,667 |
Average price Jan 25 £222,290 |
£ change £10,624 |
% Change 5.0% |
|
Region West Midlands |
Average price Jan 24 £265,310 |
Average price Jan 25 £277,768 |
£ change £12,459 |
% Change 4.7% |
|
Region Yorkshire & Humberside |
Average price Jan 24 £215,964 |
Average price Jan 25 £229,676 |
£ change £13,712 |
% Change 6.3% |
|
Region United Kingdom |
Average price Jan 24 £296,317 |
Average price Jan 25 £307,685 |
£ change £11,367 |
% Change 3.8% |
Table 5: Property type: DETACHED HOUSES
Regional average property price change between January 2024 and January 2025
|
Region |
Average price Jan 24 |
Average price Jan 25 |
£ change |
% Change |
|---|---|---|---|---|
|
Region East Midlands |
Average price Jan 24 £368,836 |
Average price Jan 25 £387,728 |
£ change £18,892 |
% Change 5.1% |
|
Region Eastern England |
Average price Jan 24 £528,179 |
Average price Jan 25 £546,482 |
£ change £18,304 |
% Change 3.5% |
|
Region Greater London |
Average price Jan 24 £936,255 |
Average price Jan 25 £944,526 |
£ change £8,271 |
% Change 0.9% |
|
Region North East |
Average price Jan 24 £183,277 |
Average price Jan 25 £190,757 |
£ change £7,480 |
% Change 4.1% |
|
Region North West |
Average price Jan 24 £237,873 |
Average price Jan 25 £252,207 |
£ change £14,334 |
% Change 6.0% |
|
Region Northern Ireland |
Average price Jan 24 £235,184 |
Average price Jan 25 £271,041 |
£ change £35,857 |
% Change 15.2% |
|
Region Scotland |
Average price Jan 24 £303,815 |
Average price Jan 25 £321,134 |
£ change £17,318 |
% Change 5.7% |
|
Region South East |
Average price Jan 24 £602,636 |
Average price Jan 25 £625,731 |
£ change £23,095 |
% Change 3.8% |
|
Region South West |
Average price Jan 24 £481,313 |
Average price Jan 25 £499,389 |
£ change £18,076 |
% Change 3.8% |
|
Region Wales |
Average price Jan 24 £341,642 |
Average price Jan 25 £357,074 |
£ change £15,431 |
% Change 4.5% |
|
Region West Midlands |
Average price Jan 24 £416,678 |
Average price Jan 25 £436,710 |
£ change £20,032 |
% Change 4.8% |
|
Region Yorkshire & Humberside |
Average price Jan 24 £215,964 |
Average price Jan 25 £229,676 |
£ change £13,712 |
% Change 6.3% |
|
Region United Kingdom |
Average price Jan 24 £453,044 |
Average price Jan 25 £471,748 |
£ change £18,704 |
% Change 4.1% |
Table 6: Gap in average price between UK property types
|
Year |
flat |
terraced |
semi-detached |
deteched |
|---|---|---|---|---|
|
Year 2000 |
flat £49,905 |
terraced £9,105 |
semi-detached £22,006 |
deteched £51,655 |
|
Year 2005 |
flat £105,277 |
terraced £15,525 |
semi-detached £39,592 |
deteched £87,263 |
|
Year 2010 |
flat £105,430 |
terraced £24,634 |
semi-detached £39,937 |
deteched £93,988 |
|
Year 2015 |
flat £118,098 |
terraced £30,319 |
semi-detached £46,202 |
deteched £99,634 |
|
Year 2020 |
flat £144,436 |
terraced £41,339 |
semi-detached £56,590 |
deteched £121,504 |
|
Year 2025 |
flat £168,569 |
terraced £66,726 |
semi-detached £72,389 |
deteched £164,063 |